

 |
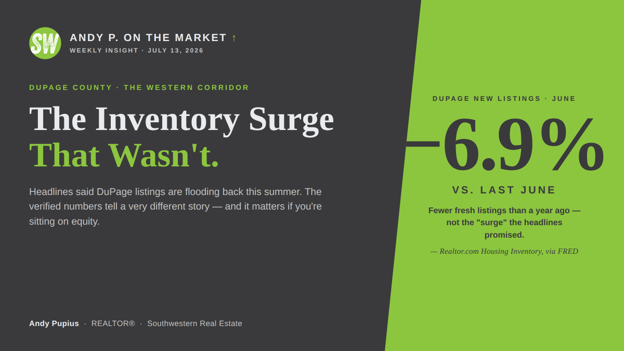
| Headlines say DuPage listings are flooding back this summer. The verified data says the opposite and if you're a homeowner sitting on equity, the difference is worth real money. |
|
This week, a claim started making the rounds: DuPage County supposedly just saw its biggest jump in new listings in over a year: double-digit growth, the long-awaited "inventory wave" finally arriving. I heard it from two clients by Wednesday. Both asked the same question: "Should we hurry up and sell before the flood hits?" It's a fair question. So I did what this newsletter always does: I went to the verified numbers instead of the headline. And the verified numbers tell a very different story. |
| 1. The "Surge" vs. The Series |
|
Realtor.com's Housing Inventory series, one consistent methodology, published through the Federal Reserve's FRED database, counted 1,074 new DuPage County listings in June. That's essentially identical to May (1,068) and April (1,082). Not a wave. A plateau. And here's the number that flips the narrative completely: measured against June of last year, new listings were DOWN 6.9%. Fewer fresh homes came to market this June than last June. |
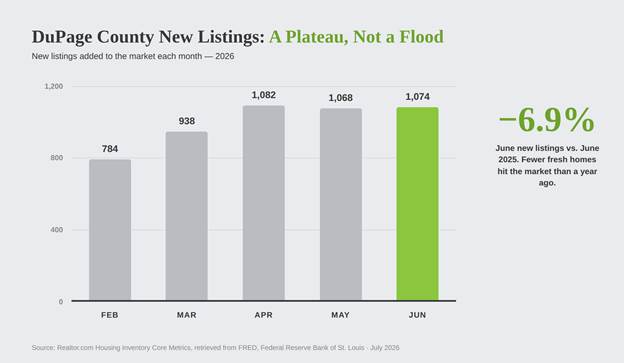 |
| DuPage County New Listings | Source: Realtor.com Housing Inventory Core Metrics, retrieved from FRED, Federal Reserve Bank of St. Louis |
|
So where did the "surge" story come from? Different trackers count listings differently. Some include condos and townhomes, some count re-lists, some use different de-duplication rules. That's why this column sticks to sources that apply one consistent method across every month and every year. When you do that, June looks like what it is: a normal seasonal plateau in a county that is still adding fewer homes than it did a year ago. And this week's fresh MRED/InfoSparks export says the same thing: on a rolling 12-month basis, DuPage single-family new listings stand at 14,694, up just half a percent from a year ago, and roughly 15% below where they ran in early 2023. Two independent sources, one conclusion: no flood. |
 What that means in practice, from this week's fresh MRED/InfoSparks exports (rolling 12 months, single-family): the median Wheaton home has been going under contract in about 7 days at a full 100% of original asking price, on just 0.9 months of supply. Winfield is even tighter at 0.8. The corridor's honest asterisk this summer is Lombard, median market time has stretched from 10 days to 13 over the past year, and supply has loosened to 1.5 months, the most breathing room anywhere in the corridor. Worth saying plainly. But 13 days and 1.5 months is still a firmly seller-tilted market, a far cry from flooded. If you own a home in the western corridor, scarcity is still your leverage. |
2. Rates: The Quiet Quarter-Point Nobody Is Talking About |
|
The second piece of this week's picture is rates, and again, the reality is calmer than the coverage. Freddie Mac's survey put the 30-year fixed at 6.49% as of July 9. It was 6.43% the week before. A year ago this week? 6.72%. That's roughly a quarter-point of improvement over twelve months, and about seven straight weeks inside a narrow band around 6.5%. Boring? Absolutely. But boring is exactly what move-up math is built on. You can't plan a sale-and-purchase around a rate that whipsaws. You can plan one around a rate that's been parked in the same spot since May. |
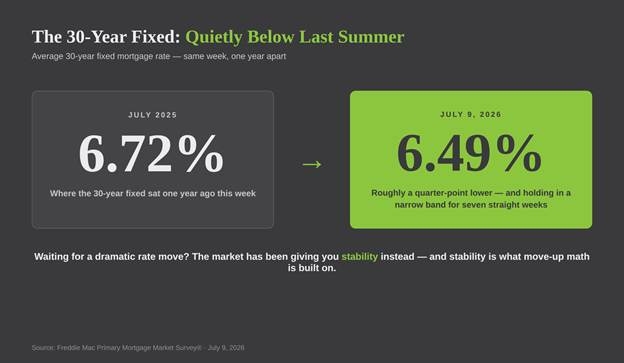 30-Year Fixed Rate Mortgage Average | Source: Freddie Mac Primary Mortgage Market Survey®, July 9, 2026 30-Year Fixed Rate Mortgage Average | Source: Freddie Mac Primary Mortgage Market Survey®, July 9, 2026 |
|
Two dates to watch in the next few weeks: the June inflation report lands Tuesday, July 15, and the Fed meets July 28–29. Add a soft June jobs report, 57,000 jobs added versus roughly 115,000 expected, per the Bureau of Labor Statistics,m and the near-term pressure on rates looks more sideways than up. No predictions here; just the calendar and the data. CORRIDOR WATCH · What I'm seeing on the ground |
| Data is one thing. Here's what the corridor looks like from inside the business this week: |
|
• Origin side: I'm preparing a new listing in Glendale Heights: a well-maintained 4-bedroom split-level with the big-ticket systems already handled, set to come to market in early August. It will enter exactly the environment described above: fewer competing listings than last summer, and buyers who absorbed everything spring offered them. Want first word when it goes live? Message me. • Destination side: I'm in conversations with homeowners in Wheaton, West Chicago and Wayne, weighing the very same math, what their equity is worth, and what it can do next. No wonder: Wheaton's rolling median is now $495,000, up 7% in a year, with the median home going under contract in a week. Both ends of the move-up corridor, in the same month. That's not a coincidence, that's the market this newsletter has been describing all year. |
| THIS WEEK IN DUPAGE · July 13–19 |
|
• Thursday, July 16 — Wheaton Municipal Band, weekly summer concert, 7:30 PM at Memorial Park, Wheaton. Free. • Saturday, July 18 — Tour of Lake Ellyn bike races, Lake Ellyn Park, Glen Ellyn — the local leg of the Chicago Grit series, benefiting the Glen House Food Pantry. • Saturday mornings — the Wheaton French Market runs downtown all summer. Details for all events are on the official village and park district calendars. |
 The Bottom Line |
If you've been waiting to make your move-up move until "more inventory shows up," this week's verified data is your answer: it hasn't, and there's no sign it's about to. New listings are running below last year. Supply is still a quarter of what a balanced market requires. Rates are lower than last summer and remarkably stable. Every one of those facts favors the owner with equity — not the owner who waits for a flood that isn't coming. |
  |